
What On-Chain Metrics Taught Me About Timing Bitcoin's Next Move
I Ignored These Charts Last Time—And Paid for It
"Risk comes from not knowing what you're doing."
Charlie Munger

This is the advantage you get from reading TheCrypt0verview.
Data isn’t just power—It’s the difference between riding the wave… Or being crushed by it.
But here’s the truth most miss:
Raw numbers alone won’t save you.
The real edge?
Knowing which data matters… When it matters…And how to act before the crowd does.
If you read our March edition and took action, kudos to you.
If you missed it, don't worry – it's still a valuable resource to help you grasp the current landscape and shift from worrying about the future to taking control.
At TheCrypt0verview, we're all about giving you the tools and confidence you need to make informed decisions.
We're not in the business of speculation or fear-mongering. We're here to help you take control and drive success.
Now, let's see what April has brought us.
Is Interest in Crypto Rebounding?
To answer this question, let's find out what these metrics tell us:
Bitcoin Apparent Demand Indicator
Realized Cap HODL Waves
Exchange Reserves
By the end of this read, you’ll know exactly where on-chain winds are blowing crypto prices
Demand is driving price action
Demand is experiencing a significant turnaround, the first of its kind since February. This uptick in demand is aligning with increased ETF inflows and long-term holder accumulation.

This isn't just a superficial bounce; on-chain data confirms that capital rotation is picking up steam. The market is exhibiting signs of renewed strength, and a key metric is whispering that retail investors are on the horizon.
Short-Term Holder Activity: Tracking Fresh Speculative Capital
Think of this as a proxy for fresh money entering the market.
We’re focusing specifically on wallets that acquired BTC within the last month (between 24 hours and 1 month ago)—a critical window for identifying speculative capital flows.

Right now, the 1-day to 1-month cohorts collectively represent around 17% of the total BTC supply, suggesting that a meaningful chunk of capital is betting on near-term upside. It’s a signal worth watching.
But these metrics and data points don't tell the whole story on their own. We've seen this play out before, where we've hit similar levels only to see prices stall or even decline. This matters because it's a crucial piece of the puzzle for BTC to reach new highs.
That being said, let's continue to add fuel to the bullish fire.
Bitcoin's Realized Cap Hits Record High
On April 28th, Bitcoin’s Realized Capitalization reached a new all-time high of $881.6 billion and it’s telling a deeper story about what’s happening beneath the surface of the market.
Let’s unpack it.

Bitcoin’s Realized Capitalization measures the total value of all BTC in circulation based on the price each coin last moved on-chain. In simple terms: it’s the sum of what investors actually paid for their Bitcoin—not what it’s worth today, but what it cost them at the time they bought it.
Unlike market cap, which reflects hype and price action, Realized Cap captures conviction. It shows how much real capital has entered the network and stayed there.
So what does an all-time high Realized Cap mean?
It means investors are buying—and holding. It means capital is flowing in, not out. And it likely means confidence is growing.
When this metric surges while price remains relatively stable, it often signals accumulation: a quiet build-up of strong hands before potential price expansion. It’s not always followed by immediate moves, but historically, it’s been a precursor to bullish momentum.
Exchange Reserves Hit Multi-Year Lows
You're likely tired of seeing this chart, but it's a vital ingredient in the recipe for a positive price action, and it perfectly complements the analysis.
Bitcoin’s Exchange Reserve across all centralized exchanges dropped to 2.4 million BTC, marking one of the lowest levels seen in BTC’s history.

In this case, the sustained and steep drop in exchange reserves over the past months supports a clear narrative: Supply is drying up, and long-term conviction is increasing. Investors are taking their coins off exchanges, a behavior that aligns with reduced sell pressure and suggests a strong accumulation phase.
So... is interest in crypto rebounding?
The data says yes.
Capital is flowing in.
Supply is drying up.
The market may not look explosive on the outside (yet), but on-chain metrics are showing signs of strength we haven’t seen in months.
This is the kind of moment where conviction and knowing what to do pays off.
What I’m Watching Right Now 👀
📌 Until BTC decisively closes above this band, I’m watching this range like a hawk.
BTC is grappling with one of the most significant zones: the 3M–6M STH Realized Price bands.
This is more than just a moving average — it’s where short-term conviction meets mid-term hesitation.
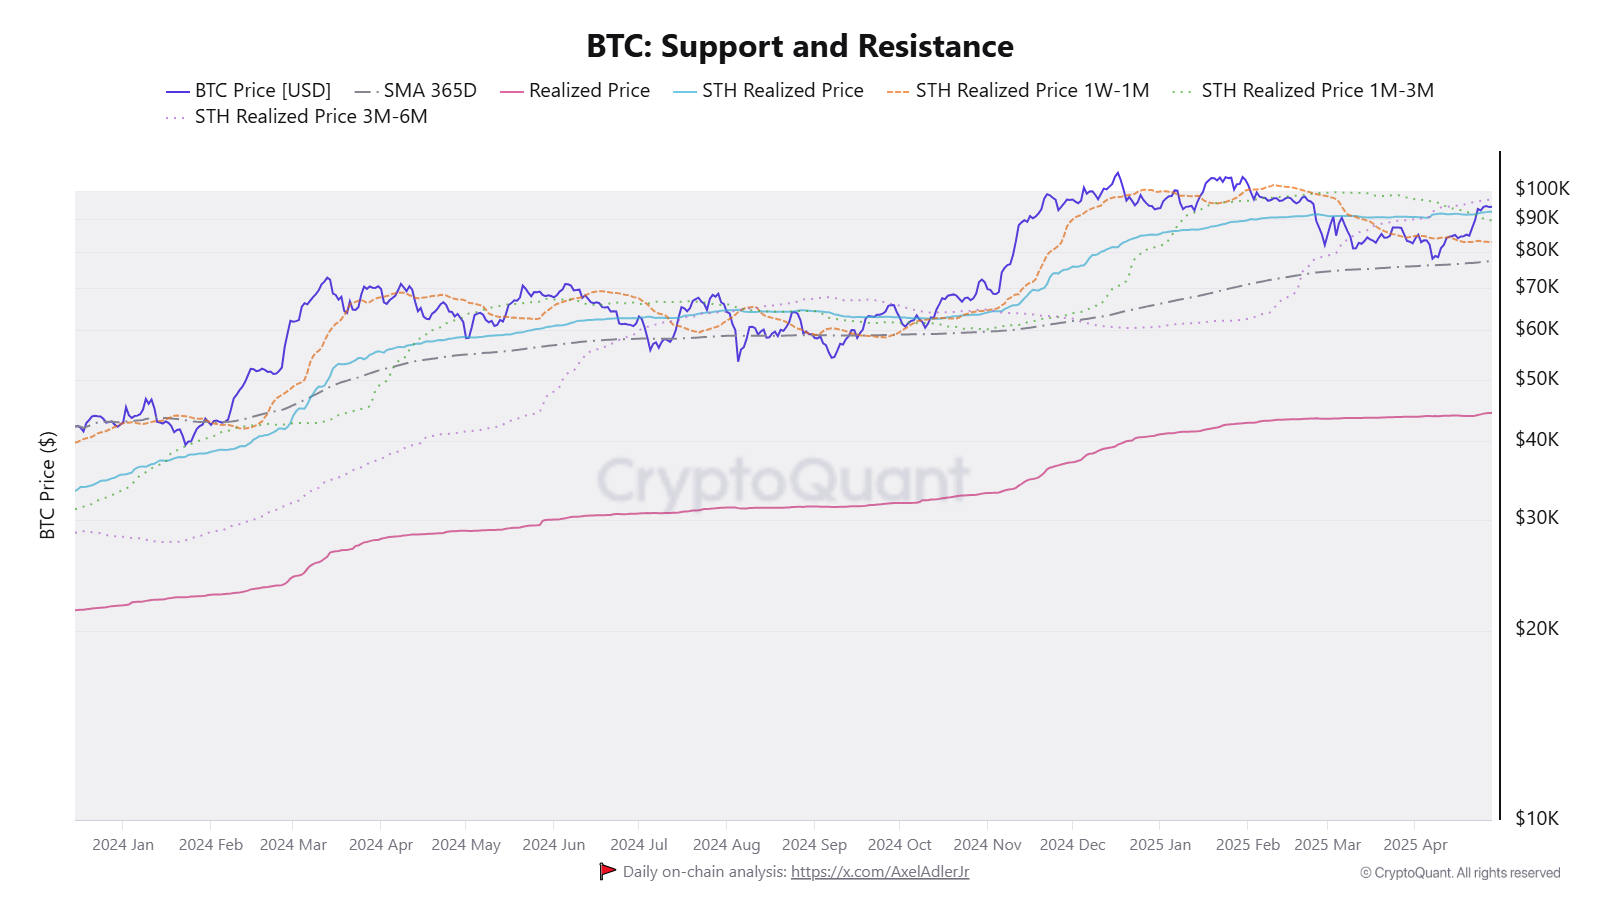
We’ve already reclaimed every other key level: Realized Price, STH RP, 1W–1M, 1M–3M…
Only this one remains.
This is where disbelief turns into FOMO.
Where weak hands either flip or vanish.
Where the next leg begins — or fails.
P.S. I'm putting my money where my mouth is, and I'm sharing my public investment portfolio with you. If you're serious about investing and want to adapt some of my strategies or ask me any questions, I'm all ears.
P.P.S Let's get real for a second. The market can be unpredictable, but with the right information and analysis, you can make informed decisions that will help you come out on top. That's why I'm sharing my expertise with you, and that's why I want you to join me on this journey to financial freedom.
Disclaimer
The content provided is for educational and informational purposes only and should not be considered as investment advice in any form.
Readers are advised to approach this information cautiously and evaluate their unique circumstances before making investment decisions. The views and opinions expressed are subject to change without notice, and no liability is assumed for any loss or damage resulting from the use of this information.